One thing we pride ourselves on at Social News Desk is developing a tool that is “for journalists, by journalists.” That motto isn’t just representative of the fact that the majority of our Client Success Team and management are former journalists, but it represents a tool that is shaped by the journalists still using it today!
Not too long ago, we released SND Reports. A visual reporting tool that allows users to create custom reports delivered to your inbox on the frequency you set. We’ve heard your feedback and have made some refreshments to the Roll-Up Report so many of you use. So without further ado…
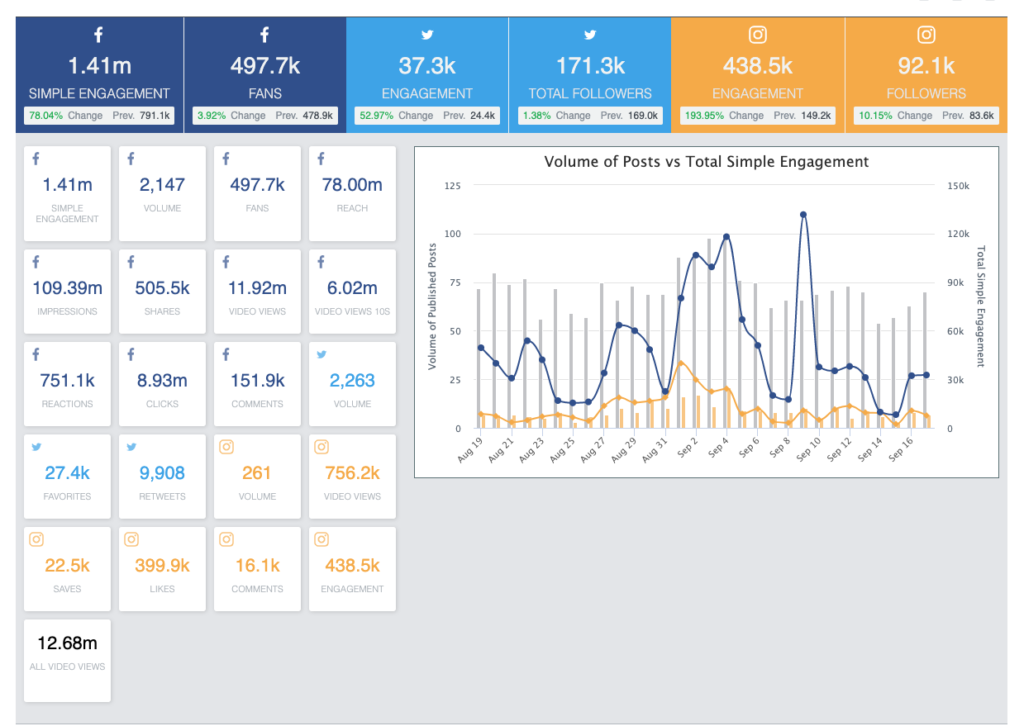
If you’ve used the roll-up report in the past, you may notice a few changes.
- Simple Engagement: This is likes + comments + shares.
- This was changed from “Total Engagement” which included post clicks. However, post clicks includes several other engagements that skewed the number in a way that wasn’t clear to users.
- With this change, you’ll also see the change in the graph. It is easier to read, and Instagram appears more prominent.
- Instagram
- Added in Likes & Comments
- Video Views
- Shows the total number of video views on Facebook and Instagram.
You’ll also find new options in the Top 10 Post sections. Facebook now has “Simple Engagement” and “Engagement”. The latter is the combination of likes, shares, comments and post clicks. We’ve also added in a “Link Clicks” option to see what your top ten posts are based on who actually click the link to go to your website.
Are there other things in SND Reports you’d like to see? We’re always open to hear your feedback. Contact your Social News Desk Client Success Manager, or email us at support@socialnewsdesk.com!
